A Bar graph also called Bar chart represents the data with vertical or horizontal bars, where length or height of the bar is proportional to the values that they represent. A vertical bar graph is also known as line graph.
A bar graph is used to show the comparison between different categories. One axis of the bar graph shows the measured value and the other axis represents the specific categories being compared.
Properties of Bar Graph
- The height or length of the bar represents the value of data.
- The width of every bar in a bar graph is always equal.
- The distance between each bar is same.
- Base for every bar is common.
For example: The bar graph below depicts that which kind of pet is owned by how many of people.
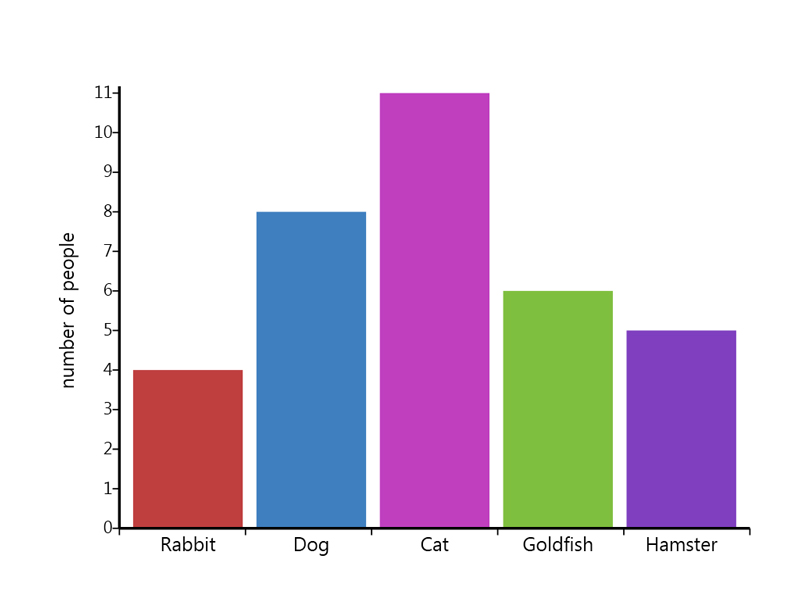
Here in this graph: Y-axis shows the number of people which own the different types of pets.
X-axis shows the categories of pet owned by different people.
From the graph we can clearly see that cat is owned by maximum number of people and rabbit is owned by minimum number of people.


 (268 votes, average: 1.34 out of 5)