A line graph or line chart represents information as a series of data points which are linked by a straight line in dot-to-dot manner. A line graph has a horizontal axis (x-axis) and a vertical axis (y-axis). Each axis is labelled as with different data type. A line graph is a very common chart used in many fields.
The axis is called “independent axis” because its value is never dependent on anything, hence time is always placed on the x-axis because it always moves forward independent of anything. More than one line can be drawn in a line chart to for comparison.
How to Draw a Line Graph
- First step is to collect all the required data.
- Create a table containing all the data.
- Label each axis.
- For the comparison of multiple items create a key.
Example: Muffins sold over a period of 7 days is shown in the table below. Construct a line chart from the table given below.
| Day | Monday | Tuesday | Wednesday | Thursday | Friday | Saturday | Sunday |
| No. of Muffins Sold | 50 | 62 | 50 | 60 | 87 | 112 | 150 |
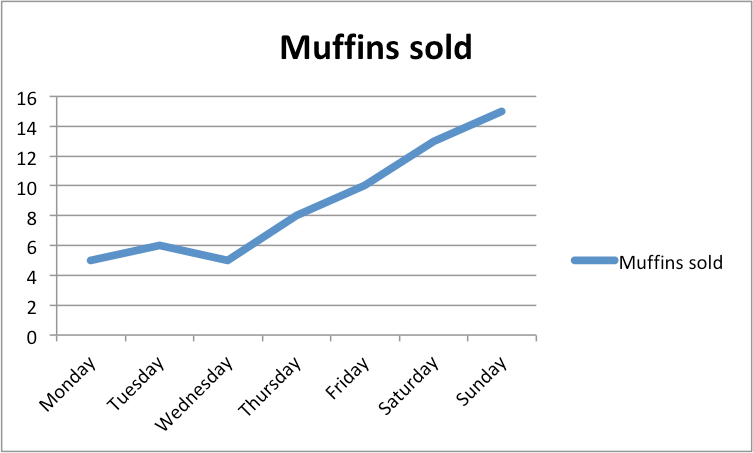
1 Unit = 10 Muffins
Rate this Article: 

 (100 votes, average: 1.42 out of 5)
(100 votes, average: 1.42 out of 5)