A Pictograph is a pictorial representation of data. Pictograph uses images and symbols that are appropriate to represent the frequency of data. Each image or symbol represents certain properties of the data.
Properties of a Pictograph
- It can be used to show large amount of data in a short and simple form.
- Easy to read.
- Minimum explanation required.
Steps to Make a Pictograph
- First step is to collect all the required data.
- Select a symbol or picture to represent the data.
- Set a scale that one symbol will represent. For example, 1 pencil representing 10 pencils.
- Draw the pictograph.
Example: A pictograph below shows the plantation of plants by a school in 6 days of the week.
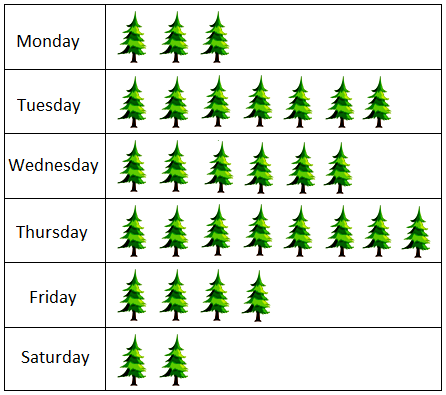
1 picture of tree represents 10 plants. Which means that total number of plants planted by the school is:
Monday = 3 x 10 = 30 plants
Tuesday = 7 x 10 = 70 plants
Wednesday = 6 x 10 = 60 plants
Thursday = 8 x 10 = 80 plants
Friday = 4 x 10 = 40 plants
Saturday = 2 x 10 = 20 plants
Total number of plants planted by school in 6 days :
30+70+60+80+40+20 = 300 plants
Rate this Article: 

 (225 votes, average: 1.78 out of 5)
(225 votes, average: 1.78 out of 5)