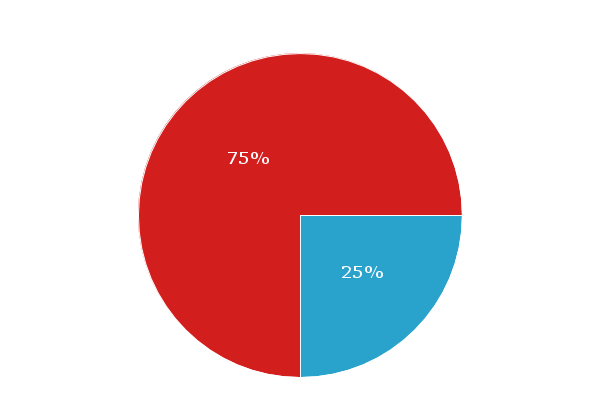
A Pie chart represents the data in a circular manner. Here data is represented by sector of circle which are in the shape of “slice of pie”. The size of each sector is proportional to the quantity it represents.is different which represents the value of the given data.
Pie charts are commonly and widely used in business world and mass media. A pie chart can be of different types:
- 3-D Pie chart.
- Pie of Pie.
- Bar of Pie.
- Doughnut.
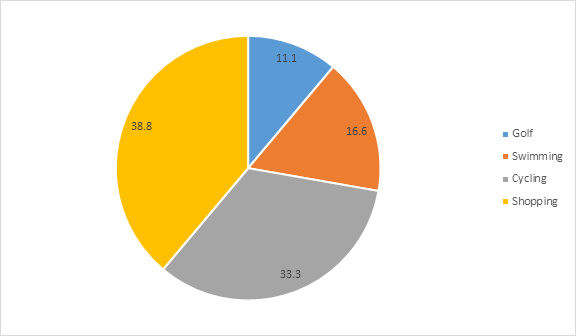
For example: If we have to make a pie chart showing the favourite activities of our friends.
| Golf | Swimming | Cycling | Shopping | Total |
|---|---|---|---|---|
| 2 | 3 | 6 | 7 | 18 |
To make the pie chart from the above given table, firstly we have to divide each value by the total and then multiply it by 100 to get the correct percentage.
| Golf | Swimming | Cycling | Shopping | Total |
|---|---|---|---|---|
| 2 | 3 | 6 | 7 | 18 |
| (2/18)* 100 = 11.1% | (3/18)* 100 = 16.6% | (6/18)* 100 = 33.3% | (7/18)* 100 = 38.8% | 100% |
Properties of Pie Chart
- The total angle of a pie chart is 360⁰.
- The angle of a particular slice of pie or sector is calculated as:
(Value of the component / Total Value) X 360⁰
- Most of the time the data represented by the sectors is in the percentage form.
Rate this Article: 

 (143 votes, average: 1.55 out of 5)
(143 votes, average: 1.55 out of 5)